Here is the one-point version: Big Tech AI CapEx may be close to a practical cash ceiling. The private AI investment market is large, but it is not large enough, or direct enough, to cleanly fill the hole.
High-growth continuation scenario.
A deliberately generous cash ceiling.
Before any private AI comparison.
Latest hard comparison point, not direct data-center cash.
What exactly is being tested?
This is not a forecast that the industry must run out of cash in 2027. It is a stress test of one narrow question:
If the recent hyperscaler CapEx curve continues into 2027, can Microsoft, Alphabet, Amazon, Meta, and Oracle fund that bill mainly from operating cash flow?
The test intentionally gives the bullish side a lot of help. It uses operating cash flow, not free cash flow, as the cash base. It lets 95% of the estimated 2026-2027 operating cash flow be deployable into CapEx. And it compares the remaining gap against the entire latest global private AI investment pool, even though that pool is not actually a direct data-center financing account.
Step 1: build the CapEx bill
The CapEx path starts from the Epoch AI hyperscaler trend for Alphabet, Amazon, Meta, Microsoft, and Oracle. The 2026 value is the published high-growth scenario. The 2027 value is this note's one-year continuation of that high-growth slope, so it should be read as a scenario, not company guidance.
| Year | CapEx used | YoY | Status in this note |
|---|---|---|---|
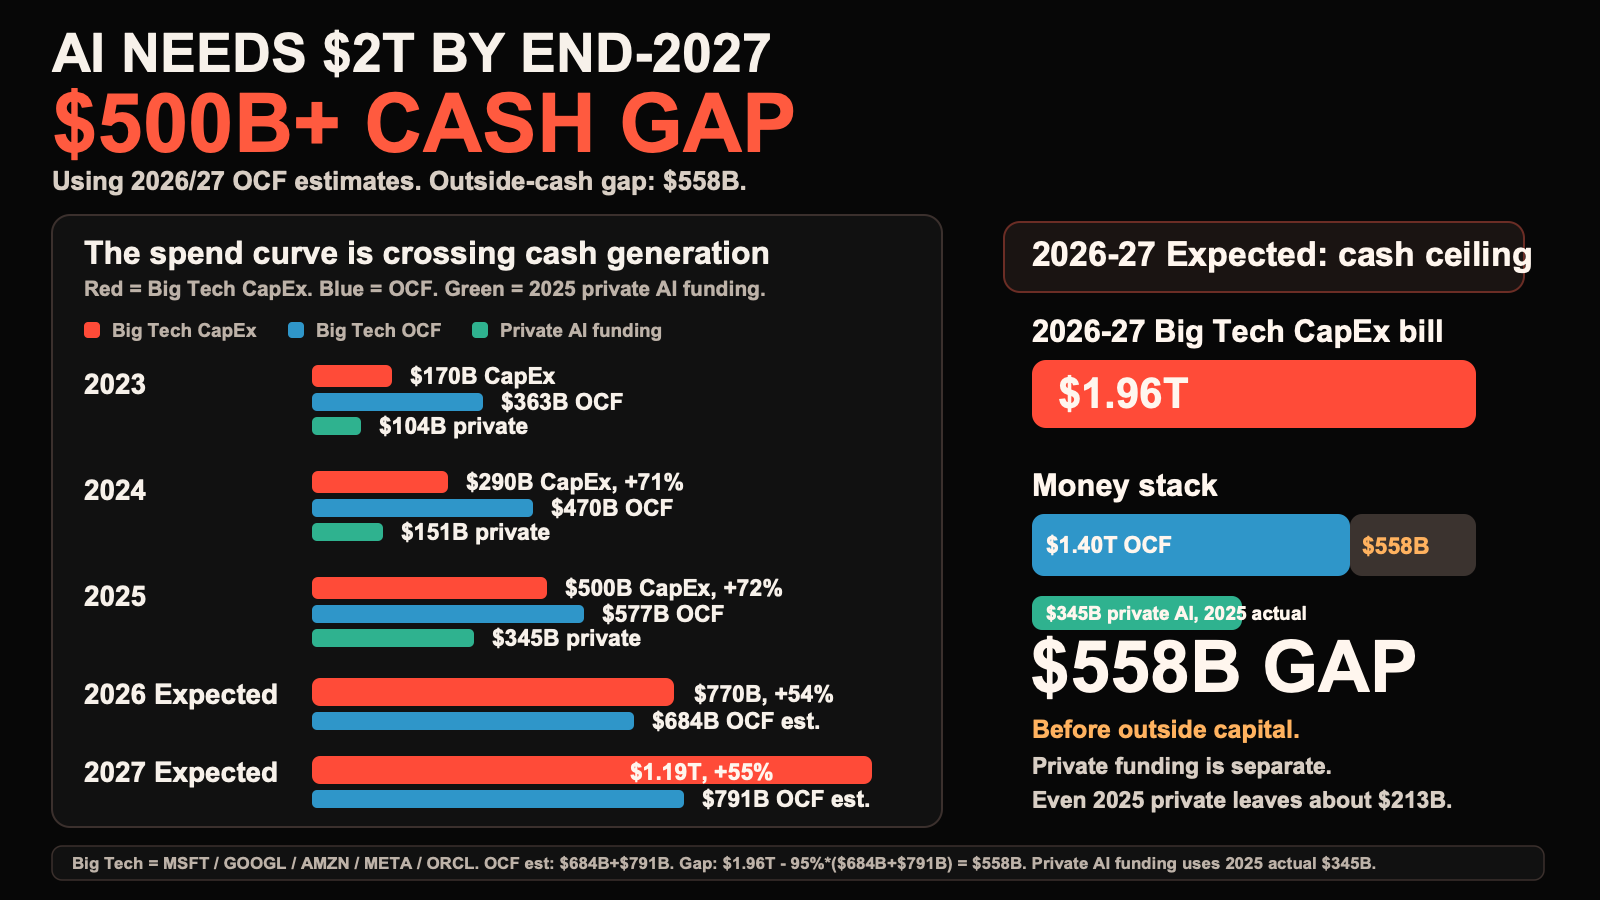
| 2023 | $170B | -- | Historical trend input. |
| 2024 | $290B | +70.6% | Historical trend input. |
| 2025 | $500B | +72.4% | Historical trend input. |
| 2026E | $770B | +54.0% | High-growth scenario value from the CapEx trend source. |
| 2027E | $1.19T | +54.5% | Continuation scenario used by this note. |
2026-2027 CapEx bill = $770B + $1.19T = about $1.96T
The important point is not the last digit. It is the scale: under this scenario, the next two years require almost two trillion dollars of capital spending from the five-company hyperscaler group.
Step 2: define the cash ceiling
The cash side uses operating cash flow, defined as net cash provided by operating activities. That choice is generous because operating cash flow is measured before the company pays for CapEx. Free cash flow would be stricter.
| Year | Big Tech OCF | Status | Method |
|---|---|---|---|
| FY2023 | $362.55B | Actual | SEC annual 10-K/companyfacts total. |
| FY2024 | $469.73B | Actual | SEC annual 10-K/companyfacts total. |
| FY2025 | $577.01B | Actual | SEC annual 10-K/companyfacts total. |
| FY2026E | $684.24B | Estimate | Add the average FY2023-FY2025 annual dollar increase. |
| FY2027E | $791.47B | Estimate | Add the same annual increase once more. |
Average annual OCF increase = (($469.73B - $362.55B) + ($577.01B - $469.73B)) / 2 = $107.23B
Now apply the deployable-cash assumption. No board can literally spend all operating cash flow on AI data centers: companies still need working capital, dividends or buybacks, debt service, non-AI CapEx, acquisitions, tax timing, and a cash buffer. So 95% deployable OCF is already an aggressive upper-bound assumption.
Deployable 2026-2027 OCF = 95% * ($684.24B + $791.47B) = $1.402T
Step 3: compute the gap
With those two pieces, the base-case gap is just the two-year CapEx bill minus the deployable operating cash flow pool.
Outside-cash gap = $1.96T - $1.402T = $558.08B
That is the amount the scenario asks the companies to cover through some mix of balance-sheet cash, debt, leases, project finance, sovereign capital, partner capital, higher revenue, slower CapEx, or lower compute cost.
Now compare that number with private AI investment. Stanford AI Index reports 2025 global private AI investment at $344.66B. Even under the unrealistic assumption that every dollar of that private AI investment could be redirected into hyperscaler data-center CapEx, the remaining gap is still large:
$558.08B - $344.66B = $213.42B
This is why I do not treat private AI funding as a clean solution. It is mostly startup and private-market capital. It is not a direct funding line for grid interconnects, leases, substations, data centers, GPUs, and power equipment at the hyperscaler level.
How fragile is the result?
The exact gap depends on two assumptions: how much of operating cash flow is realistically deployable, and whether the 2027 CapEx slope slows. The result is not binary; it is a pressure curve.
| Deployable OCF share | Deployable OCF pool | Gap before private AI comparison | Interpretation |
|---|---|---|---|
| 100% | $1.476T | $484B | Impossible upper bound: all operating cash flow goes to CapEx. |
| 95% | $1.402T | $558B | Base case here; still extremely generous. |
| 90% | $1.328T | $632B | Still aggressive, but leaves more corporate cash needs intact. |
| 80% | $1.181T | $779B | A more conservative ceiling makes the financing problem larger. |
| 2027 CapEx scenario | 2026-2027 CapEx bill | Gap at 95% deployable OCF | What it means |
|---|---|---|---|
| $770B, flat from 2026 | $1.54T | $138B | The pressure becomes much easier if CapEx stops growing. |
| $963B, +25% from 2026 | $1.73T | $331B | A slower but still large buildout keeps a meaningful gap. |
| $1.19T, +54.5% from 2026 | $1.96T | $558B | The high-growth continuation scenario creates the cash-wall result. |
The conclusion is therefore conditional but useful: the more the AI buildout depends on continuing the recent CapEx slope, the more it depends on outside financing, better utilization, cheaper compute, higher revenue, or a slower buildout.
The signal
This does not mean AI demand vanished. It means the easy part of the CapEx cycle may be over.
That is a useful lens for the strange noise under the boom: product pauses, lab reorganizations, AI app trimming, and teams being forced to justify the next unit of compute. These are not proof of one single cause. But they fit a world where the bill is no longer abstract.
For the next phase, the question becomes less glamorous: who can get power, lock hardware, finance the buildout, sign long customers, and cut inference cost fast enough?
Data sources and calculation notes
This note is adapted from a Matrix Team discussion based on an AI2026 CapEx research report. It is a scenario note, not investment advice. Dollar values are nominal USD. Values in prose and charts are rounded; the calculation below uses the source-level values shown here unless otherwise noted.
Inputs used in the chart
| Input | Value used | Source and exact meaning | How it is used |
|---|---|---|---|
| Hyperscaler CapEx path | 2023 $170B; 2024 $290B; 2025 $500B; 2026E $770B; 2027E $1.19T. | Epoch AI, hyperscaler CapEx trend. The source tracks Alphabet, Amazon, Meta, Microsoft, and Oracle using SEC filings, including cash spending and new finance leases. The 2027 value is this note's continuation scenario, not company guidance. | Defines the two-year expected CapEx bill: $770B + $1.19T = about $1.96T. |
| FY2025 Big Tech operating cash flow | $577.010B total. | SEC companyfacts / annual 10-K facts for Microsoft, Alphabet, Amazon, Meta, and Oracle. XBRL concept: us-gaap:NetCashProvidedByUsedInOperatingActivities, filtered to fy=2025, form=10-K, fp=FY. |
Base year for the estimated cash-flow ceiling. |
| Estimated 2026-2027 operating cash flow | 2026E $684.24B; 2027E $791.47B. | Internal scenario estimate: extend the average annual dollar increase from FY2023 to FY2025. FY2023 total was $362.55B, FY2024 was $469.73B, FY2025 was $577.01B, so the average annual increase is about $107.23B. | Uses an aggressive 95% deployable ceiling: 95% * ($684.24B + $791.47B) = about $1.40T. |
| Global private AI investment | $344.66B in 2025, rounded to $345B. | Stanford AI Index 2026, Economy chapter, Figure 4.2.2, "Global private investment in AI, 2013-25"; source listed as Quid. | Used only as the latest hard private-market comparison point, not as a forecast for 2026 or 2027. |
Operating cash flow facts
The SEC companyfacts JSON contains the structured value, accession number, fiscal year, period dates, filing date, and form. The inline XBRL fact id is in the direct 10-K HTML filing, so both links are included for end-to-end verification.
| Company | FY2025 OCF | Period end | Filed | Accession | SEC links |
|---|---|---|---|---|---|
| Microsoft | $136.162B | 2025-06-30 | 2025-07-30 | 0000950170-25-100235 |
companyfacts / 10-K fact |
| Alphabet | $164.713B | 2025-12-31 | 2026-02-05 | 0001652044-26-000018 |
companyfacts / 10-K fact |
| Amazon | $139.514B | 2025-12-31 | 2026-02-06 | 0001018724-26-000004 |
companyfacts / 10-K fact |
| Meta | $115.800B | 2025-12-31 | 2026-01-29 | 0001628280-26-003942 |
companyfacts / 10-K fact |
| Oracle | $20.821B | 2025-05-31 | 2025-06-18 | 0000950170-25-087926 |
companyfacts / 10-K fact |
Scenario math
Average annual OCF increase = (($469.73B - $362.55B) + ($577.01B - $469.73B)) / 2 = $107.23B
2026E OCF = $577.01B + $107.23B = $684.24B; 2027E OCF = $684.24B + $107.23B = $791.47B
Outside-cash gap = $1.96T - 95% * ($684.24B + $791.47B) = $558.08B
Gap after the latest private AI investment comparison = $558.08B - $344.66B = $213.42B
The 95% deployable-OCF assumption is intentionally generous. It does not imply these companies can or should spend 95% of operating cash flow on AI data centers; it is a stress-test ceiling after which the remaining gap is still large.
Important limitations
- The 2026 and 2027 OCF values are estimates, not company guidance.
- The 2027 CapEx number is a high-growth continuation scenario, not a disclosed budget.
- Private AI investment is global startup/private-market capital. It is not directly interchangeable with hyperscaler data-center financing.
- The calculation does not model debt issuance, leases, project finance, sovereign capital, future revenue growth, power constraints, GPU utilization gains, or lower hardware/inference cost. Any of those could change the gap.